
Saved. I can now #draw without fear if the ink running out. That should do it. #drawing #art #colour

#video and #paper #installation with #platonicsolids is definitely making headway. #art #sculpture #science #geometry #geology #landscape #water #earth #iceland
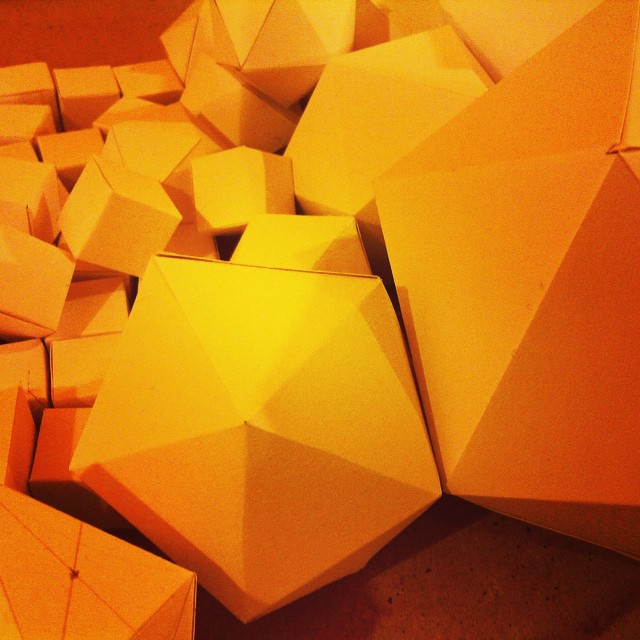
Some prep has been made. A bit of play time with #platonicsolids is what’s happening today. #art #sculpture #science #paper #geometry #geology #landscape #water #earth

Tools of a #geometric #artist . Where would I be without a spirit level and a bunch of #platonicsolid nets?! #art #science #landscape #iceland

This makeshift #filming contraption is proving invaluable for the #timelapse of the details of my big #drawing . #art #science #perspective #iceland

#paper #constructions begin for a structural #video #installation . #art #geometry #geology #landscape #water #iceland

#colour finally added to the large scale #drawing showing my thought process for the last two months. #art #science #duality #landscape #perspective #perception #light #refraction

Real progress being made on my biggest #drawing to date. #art #perspective #duality #landscape #iceland #light #perception

Napa Valley quake. The biggest earthquake in 25 years struck California’s Napa Valley in the early hours of 24 August 2014. By processing two Sentinel-1A images, which were acquired on 7 August and 31 August 2014 over this wine-producing region, an interferogram was generated. The two round shapes around Napa valley, which are visible in the central part of the image show how the ground moved during the quake. Deformation on the ground causes phase changes in radar signals that appear as the rainbow-coloured patterns. Each colour cycle corresponds to a deformation of 28 mm deformation. The maximum deformation is more than 10 cm, and an area of about 30x30 km was affected significantly.
(Via esa)


Visually overloaded after a road trip of #iceland . Decided to postpone the editing of thousands of #photographs of #glaciers #geysers and #volcanoes in favour of some #crystal inspired #drawing . #art #science #sculpture #landscape #geology

Icosahedron which has 20 triangles, 12 vertices and 30 edges. The triangle subdivision of the icosahedron increases the number of triangles by a factor of 4. At each subdivision, the vertices are projected onto the sphere. At the subsequent level of refinement, we have (42, 80), (162, 320), (642, 1280), (2562, 5120), (10242, 20480), (40962, 81920) faces and vertices.
Credit: Moo K. Chung and Seong Ho Seo
Source: Heat Kernel Smoothing via Laplace-Beltrami Eigenfunctions, Waisman Laboratory for Brain Imaging and Behavior, University of Wisconsin–Madison

Images scanned from Structures in Art and in Science
Edited by Gyorgy Kepes
Published 1965 by George Braziller, Inc.

Günther Uecker (b. 1930) Nagelbild, 1969

Mario Botta
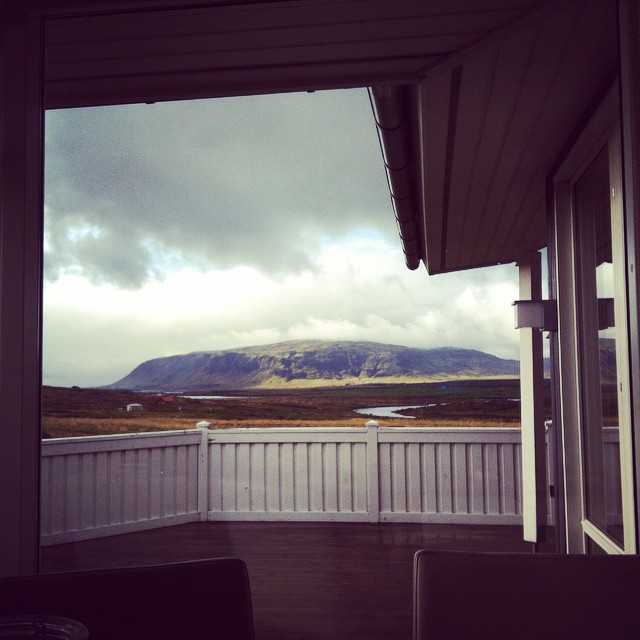
Morning view of the #mountain. First clear day for a while should allow for easier #photography . #art #landscape #iceland #nature #roadtrip

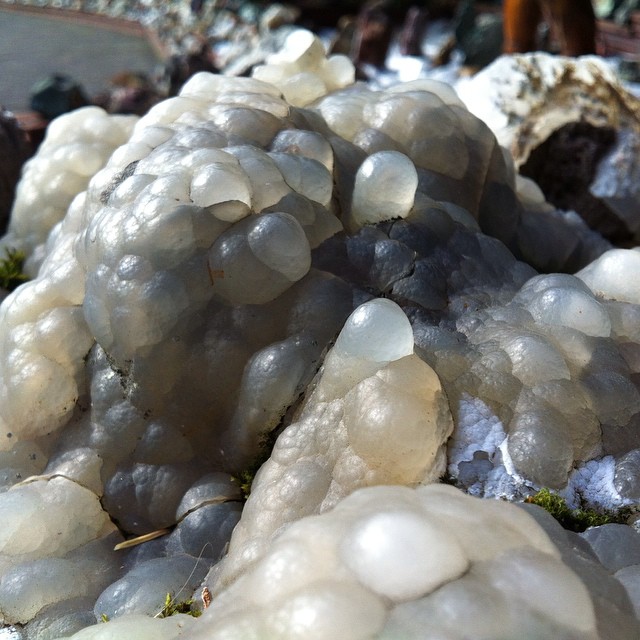
BubbleWaves

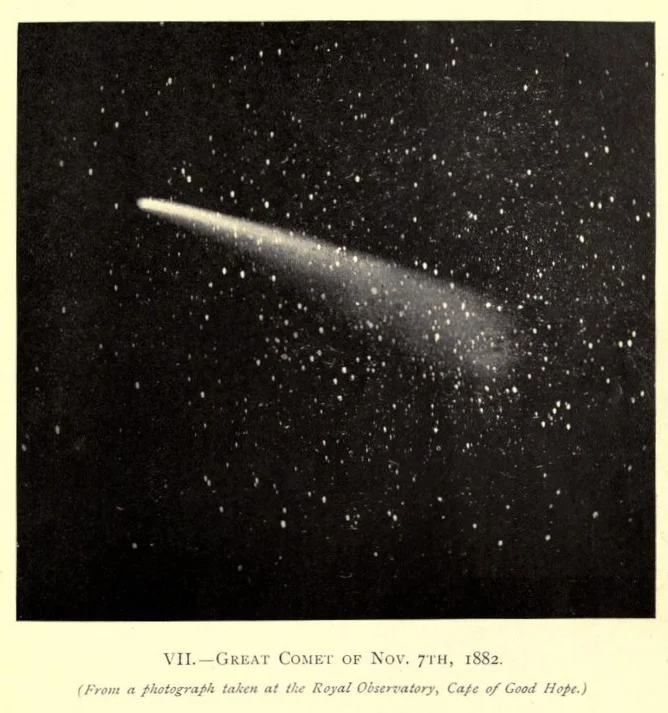
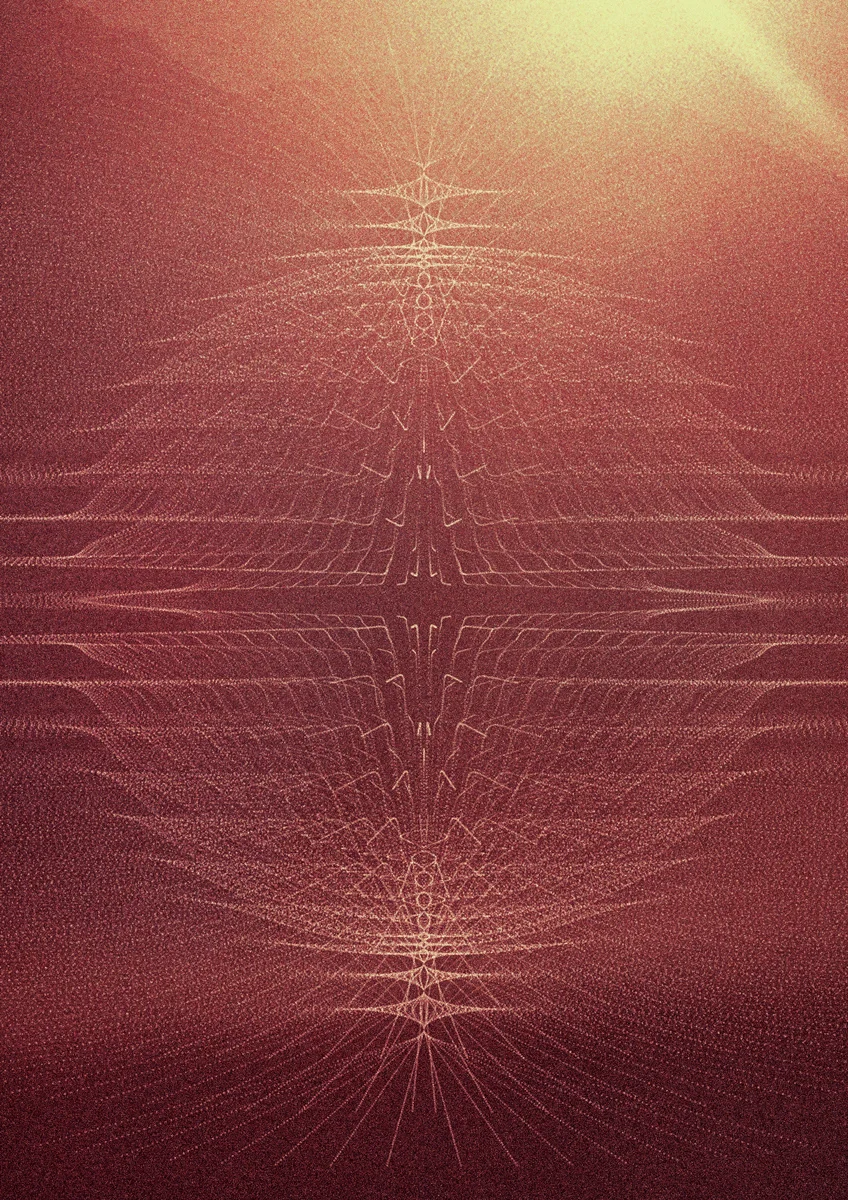
VII. Great Comet of Nov. 7th, 1882.